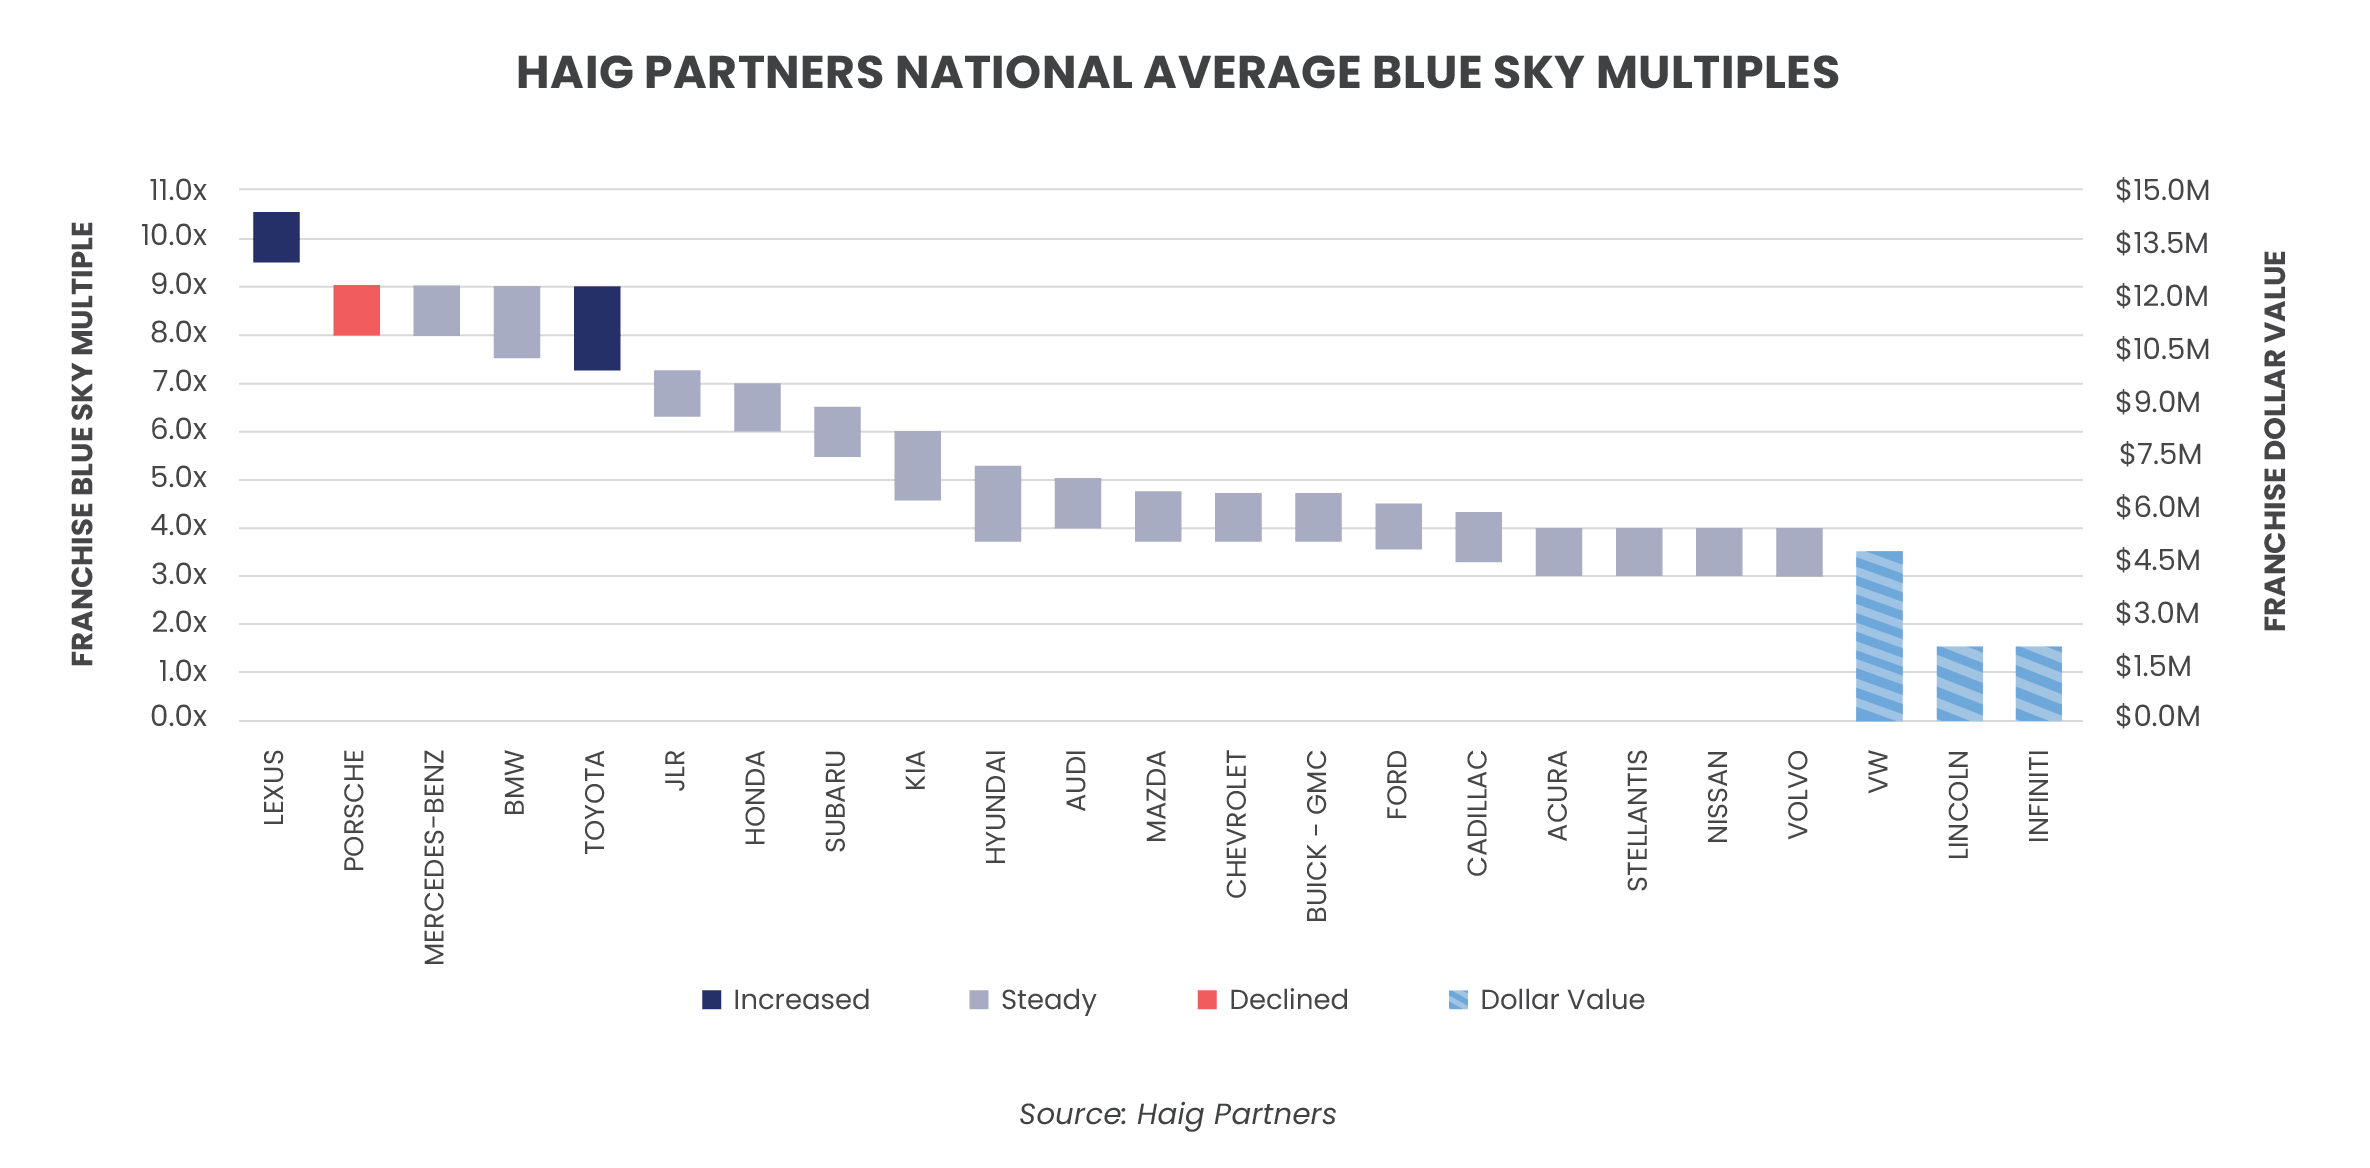
Lexus sales declined 7.5% in Q2 2026 compared to Q2 2025, but dealers remain highly bullish on the franchise. The decline appears to be more of a supply and product-transition issue than a demand issue. Lexus dealers continue to report excellent profitability, strong UIOs, a constructive factory relationship and very little aged inventory. The RX remained the brand’s volume leader and increased 8.5% in Q2, while the TX increased 3.4% and continues to give Lexus a high-demand three-row family SUV. The IS also increased 77.7%, while the RZ and UX grew 44.4% and 25.2%, respectively. The biggest drag was the ES, which declined 91.5% as Lexus transitioned to the redesigned model and its updated hybrid / EV lineup. GX sales also declined 33.5% after a strong launch period, while NX sales fell 13.4%.
Dealer complaints are limited and familiar: they just need more vehicles. Inventory remains extremely tight, and dealers tell us that most Lexus vehicles are turning in two weeks or less. Lexus has also indicated that inventory is likely to remain low for the foreseeable future. This scarcity is helping dealers preserve margins, although some markets are seeing more pressure on front-end gross. Even in those markets, the combination of front-end margin, F&I income and fixed operations remains highly attractive.
The primary frustration is allocation. Dealers who want more volume can pursue facility improvements to improve their allocation position, but the cost can be significant. Some dealers estimate that each incremental unit of allocation can require roughly $35,000 of facility investment, making growth within the network expensive.
From a buy-sell perspective, Lexus remains one of the hardest franchises to acquire in auto retail. The barrier is not just the price tag. Buyers also need significant face time with the factory and a long approval runway, even if they appear qualified. Scarcity, strong dealer profitability, excellent factory relations and intense buyer demand continue to place upward pressure on franchise valuations.
Porsche sales declined 16.7% in Q2 2026 compared to Q2 2025, the second-largest decline of the brands we track. Dealer sentiment has become more cautious, and Porsche’s slip to 9th place in NADA’s Winter Dealer Attitude Survey reflects that the franchise is not enjoying the same level of dealer enthusiasm that it has in recent years. That said, Porsche continues to perform extremely well with customers, ranking #1 in recent J.D. Power Sales, Service, Quality and Appeal studies, a reminder that the brand’s customer-facing strength remains exceptional even as dealers work through a more difficult operating period. Porsche remains a trophy franchise with wealthy, loyal customers, strong brand equity and attractive dealer profitability, but the near-term story has become more complex.
Porsche’s product issues are most visible with the Macan and 718. Dealers remain frustrated that the ICE Macan is disappearing from the lineup, leaving a near-term hole in one of Porsche’s most important U.S. segments. The Macan EV is a strong product, but many Porsche customers still want an ICE SUV in this size class. Dealers understand that Porsche is working on a future ICE replacement, which should help the long-term investment case, but the timing still leaves retailers exposed in the near term. Dealers are also preparing for an electric 718, but many would still like clarity on whether there will be an ICE successor. The concern is not that Porsche lacks brand equity; the concern is that dealers are losing profitable ICE products before replacement products are fully in market.
There are still important positives, but some of those positives are noisy. The 911 remains one of the most desirable vehicles in the industry and sales are up significantly this year. However, dealers noted that some 911s are now sitting in showrooms, which is highly uncommon for a model that has historically been supply-constrained and heavily presold. Fixed operations and CPO performance remain strong and continue to support dealer profitability, but the new vehicle side of the business is more unsteady than it has been in recent years. The Cayenne EV is generating enthusiasm, and dealers who have participated in product training have given positive feedback. Dealers are hopeful it will add incremental volume because it joins the existing ICE and plug-in hybrid Cayenne lineup rather than replacing it. Dealers are much more receptive to EVs when they expand the lineup instead of replacing profitable ICE products entirely.
The largest concern remains the brand’s facility requirements, which are among the most expensive in the industry. Most current dealers are either planning to invest, actively building, or have already completed their new facilities, but the cost of these upgrades pressures store profits in terms of rent, insurance and other operating costs. Many of those dealers remain profitable and added service capacity can improve store economics over time, but the math is harder for lower-volume stores or stores with unresolved image obligations. Dealers selling fewer than 200 new vehicles per year may face facility requirements far larger than their current volume can support. We have also seen situations where unresolved facility commitments became significant hurdles and impacted transaction pricing. Porsche stores with completed facilities can still attract premium interest, but stores with unresolved obligations are increasingly difficult to underwrite.
Future product could improve the story, particularly if Porsche successfully fills the ICE Macan gap and adds a 7-passenger ICE SUV. Until then, buyer demand will depend heavily on facility status, store volume, product cadence and whether the required real estate investment can pencil against current and expected earnings. Porsche remains highly desirable, but buyers are underwriting the franchise with more caution than they were a few years ago.
Mercedes-Benz sales declined 3.0% in Q2 2026 compared to Q2 2025 and are down 3.2% year-to-date. The brand’s plan to grow sales by 100,000 units has not taken off quite yet, but dealers remain optimistic that the turn is coming. Dealer sentiment toward Mercedes-Benz is stronger than the change in sales suggests. Retailers remain pleased with a management team that they describe as responsive to dealer concerns, and they continue to view Mercedes-Benz as one of the most desirable luxury franchises in the industry.
Several dealers told us Mercedes-Benz sits just behind Lexus in terms of desirability. Buyers still see better times ahead for Mercedes-Benz, driven by new products in key segments, improving lease competitiveness and a factory relationship that dealers generally trust. Mercedes-Benz’s two-year leasing programs are also helping the brand take back share, which is important in a luxury market where payment, lease support and product cadence can shift momentum quickly.
There are still areas where dealers want improvement. Some dealers believe Mercedes-Benz product still lags BMW in certain segments, but they are optimistic that help is on the way. Dealers also describe Mercedes-Benz’s facility requirements as reasonable, which compares favorably against several other luxury OEMs and helps support buyer appetite. The larger unresolved issue is commercial vans. Sprinter and other commercial van products have become expensive, and dealers say the franchise has lost share to competitors. That has left dealers with Sprinter franchises earning significantly less profit than they did in prior years.
Dealers also continue to ask for a stronger advertising plan. While retailers generally compliment senior management, the sales team and the network team, they believe the brand would benefit from more effective marketing support as new products arrive and competition remains intense.
From a buy-sell perspective, Mercedes-Benz remains highly attractive. We are involved in the sale of several Mercedes-Benz dealerships, and buyer appetite is strong. Buyers are trying to acquire stores before product momentum improves, profits increase and blue sky values move higher. That demand is keeping Mercedes-Benz multiples strong even as many other franchises face declining earnings and more cautious buyer underwriting.
BMW sales increased 13.0% in Q2 2026 compared to Q2 2025, one of the strongest results among the luxury franchises we track. Dealers remain highly confident in BMW, and demand for its dealerships remains high. The franchise continues to benefit from an attractive product portfolio, rising fixed operations, strong retailer profitability and solid consumer demand. The X5 was the standout in Q2, increasing 41.6%, while the X3 increased 11.9%, the 3 Series increased 56.8%, and the X1 increased 31.3%. Importantly, these gains arrived on core, high-volume products that make a significant impact on store-level earnings.
The tone from dealers is steady and positive. BMW is not generating the same “comeback story” excitement as Mercedes-Benz, but it also does not need to. Dealers describe BMW as consistent, desirable and easier to underwrite than most luxury franchises. Some noted that Mercedes-Benz stores may be slightly more profitable today in certain examples, but BMW remains one of the safest luxury acquisitions in the market. Buyers already in the franchise want to expand, and buyers outside the brand continue to pursue BMW stores when they become available.
The next product cycle is a growing source of excitement. BMW’s Neue Klasse rollout begins with the fully electric iX3, and BMW has said it plans to introduce more than 40 new or updated models by the end of 2027. Just as important, the technology developed for Neue Klasse is expected to spread across the broader portfolio, regardless of powertrain. Dealers view this flexibility as a major advantage. BMW is not forcing one powertrain strategy on the market; it is preparing to sell ICE, hybrid, plug-in hybrid and EV products based on what customers actually want. The new X5 is a good example, with BMW describing it as “one model, five drives,” including gasoline, diesel, plug-in hybrid, battery-electric and hydrogen versions in select markets.
There is some risk. Neue Klasse represents a major design and technology shift, including a more radical interior with BMW’s panoramic display replacing the traditional instrument cluster. Dealers acknowledge that some BMW designs have been controversial at launch, but they also note that BMW has a history of moving the market toward its designs over time. For now, dealers are more excited than worried.
From a buy-sell perspective, BMW remains a premium luxury franchise with few near-term negatives. Sales are growing, fixed operations are expanding, the product cycle is freshening, and the factory has maintained enough powertrain flexibility to avoid the strategic mistakes some competitors made during the EV rush. For buyers looking at luxury franchises, BMW represents one of the cleanest acquisition opportunities in the industry.
JLR sales declined 15.2% in Q2 2026 compared to Q2 2025, but dealer sentiment remains stronger than the headline sales result suggests. Buyers and dealers are still focused on Land Rover, not Jaguar. Range Rover and Defender remain the core of the franchise, and both continue to attract wealthy, loyal customers who are less sensitive to payment pressure than the broader market. Dealers report tight inventory, strong grosses and excellent fixed operations, particularly around the higher-end Land Rover products.
The model-level data aligns with dealer sentiment. The Defender declined 6.4% in Q2 but remains one of the brand’s most important products and continues to generate strong loyalty. The Range Rover declined 19.2%, while the Range Rover Sport increased 1.6%, driven by strength in the gasoline model despite weaker plug-in hybrid volume. The Discovery, Discovery Sport, Evoque and Velar were all down sharply, aligning with dealer comments that the lower-volume Discovery side of the lineup is not what drives the value of this franchise. These vehicles help provide showroom variety and segment coverage, but they do not carry the same profit potential as the Range Rover or Defender.
Jaguar remains the unknown and is largely absent from underwriting conversations. The brand has little volume today, and many buyers give it little weight when pursuing a JLR store. Dealers are waiting to see what Jaguar becomes as it transitions to an all-electric future, but current buyer demand for JLR is almost entirely tied to Land Rover’s high-end SUV portfolio and the fixed operations base that comes with it.
The future product story is also more encouraging on the Land Rover side. JLR recently said it plans to offer more propulsion flexibility across the Range Rover, Defender and Discovery, including MHEV, HEV, PHEV and BEV options, while Jaguar will remain fully electric. The company also highlighted North America as a growth priority and is exploring a collaboration with Stellantis focused on Defender products designed specifically for the U.S. market. We believe that is the right area of focus. If JLR can preserve scarcity, add more flexible powertrains and keep the Range Rover and Defender special, dealers should continue to make strong profits even if reported sales volumes are choppy.
Audi sales declined 3.1% in Q2 2026 compared to Q2 2025, and dealers describe the franchise as being largely stuck in the same position it has been for the past several quarters. Audi is not broken, but it is still working through a difficult product cycle and store-level performance remains well below that of prior years. Dealers we spoke with still have faith in the brand and believe the factory has improved its communication and support, but most acknowledge that dealership economics could remain pressured for the next couple of years.
The model-level results show how uneven the lineup is today. Q5 sales increased 30.1% in Q2, which is helpful given the importance of that vehicle to Audi’s U.S. business, although the comparison was likely aided by last year’s tariff-related shipment disruption. Audi paused U.S. imports in April 2025 after the 25% auto tariff took effect, and the Q5 was one of the most exposed models given its Mexican production and importance to Audi’s U.S. sales mix. Q8 sales also increased 46.9%, while A3 and A5 posted gains. But those positives were offset by weaker Q7 and Q3 volumes and steep declines in several EV nameplates. Audi’s problem is not that it lacks good vehicles. The issue is that the lineup has been caught between aging core products, weak EV demand and stronger execution from BMW, Lexus and Mercedes-Benz.
Factory relations are one of the brighter spots. Dealers say Audi’s field organization and factory leadership have become more responsive, particularly around specialty allocations, parts support and day-to-day operating issues. Several dealers are cautiously optimistic with Vito Paladino now leading Audi of America, saying he has been open with the dealer body and willing to listen to the challenges retailers are facing. That does not fix gross profit overnight, but it helps keep dealers engaged during a difficult stretch.
Audi’s near-term product pipeline is also compelling. Audi has introduced the all-new 2027 Q7, and the upcoming Q9 will finally give Audi a full-size, three-row flagship SUV to compete more directly with the BMW X7 and Mercedes-Benz GLS. Dealers are especially focused on the Q7 and Q9 because Audi needs fresh, high-margin SUVs to rebuild momentum in the U.S. market.
From a buy-sell perspective, Audi remains an opportunity for risk-tolerant buyers. Focused operators can still make money, but the franchise requires more attention than stronger luxury brands. Franchise values are likely to remain under pressure until the new product cycle begins to show up in dealer earnings. Still, Audi has loyal customers, a global luxury reputation and a factory that appears more engaged than it has been in years. As one dealer put it, the brand may be approaching a “nowhere to go but up” moment.
Cadillac sales declined 19.2% in Q2 2026 compared to Q2 2025, the greatest decline among the franchises we track. Dealer feedback was negative. Several dealers said they are losing market share because the current lineup is too EV-centric for many of their customers. Cadillac has attractive products, but the brand moved too far into EVs before enough buyers were ready. That shift left dealers with limited ICE inventory in some of the most important luxury segments.
Current issues can almost all be found in the showroom. Dealers essentially have the Escalade, the aging XT5 and a growing number of EVs. The Escalade remains the franchise’s profit engine, but it cannot carry the entire brand. The XT5 is outdated compared to newer luxury crossovers, yet it still does some volume because it is one of the few non-EV options available. The rest of the lineup is increasingly weighted toward Lyriq, Optiq, Vistiq and Escalade IQ. Those vehicles may work in select EV-friendly markets, but dealers in many regions are finding that customers still want gasoline or hybrid luxury SUVs.
In terms of sales, Escalade volume declined in Q2, and Lyriq sales also fell after helping Cadillac last year. The newer EVs are beginning to add volume, but not enough to offset the weakness in the broader lineup or replace the ICE products dealers lost. Cadillac dealers are encouraged that GM appears to be listening and pivoting back toward internal combustion products, but the correction will take time.
Cadillac has confirmed that XT5 will return for the U.S. market and be built in Spring Hill, Tennessee, and reporting suggests the redesigned U.S. model could arrive around 2028 with hybrid or gasoline powertrains. Cadillac has also confirmed that CT5 will continue in the U.S. with an internal combustion engine, with the next generation expected later in the decade. The XT6 is also expected to return with a gasoline engine after Cadillac previously planned to discontinue it.
Dealers want those products as soon as possible, but many believe that real relief may not arrive until 2028. Until then, Cadillac dealership performance will likely remain highly market-dependent. Stores in EV-friendly metros can still perform well, and the Escalade remains one of the best luxury products in the industry. But many dealers are frustrated with the current lineup and believe Cadillac gave up too much ICE coverage too quickly. From a buy-sell perspective, buyers will underwrite Cadillac carefully until the product plan becomes more balanced and the brand can prove it can regain share outside its strongest EV markets.
Volvo sales increased 9.0% in Q2 2026 compared to Q2 2025, but dealer sentiment toward the franchise is largely unchanged from recent quarters. Volvo continues to occupy a niche position in the U.S. market. The brand performs well in select markets, particularly those with higher-income customers, stronger brand loyalty and greater openness to electrified products. In other parts of the country, however, many dealers continue to face profitability challenges, and buyer demand for the franchise remains highly market-dependent.
Volvo’s product lineup still has attractive qualities. The brand’s broad offering of plug-in hybrids gives dealers a useful bridge between traditional ICE products and full EVs, and Volvo customers remain fans of its safety, design and technology. That positioning has helped the brand maintain a differentiated identity, even as competition in many of its segments has become more competitive. A key challenge is affordability. The expiration of federal EV and plug-in hybrid tax credits has created pricing headwinds, particularly for customers who were already sensitive to higher interest rates, insurance costs and monthly payments.
The larger product concern is that Volvo’s investment in electrification has left parts of its ICE lineup with less development than dealers would like. Volvo is not alone in this issue, but the impact is more visible for a smaller OEM competing against larger brands with deeper product budgets, broader hybrid lineups and faster redesign cycles. Dealers still like Volvo’s brand identity, but some worry the product cadence has not kept pace with the strongest luxury and near-luxury competitors.
Volvo’s Chinese ownership has not created meaningful day-to-day challenges for dealers, but it remains a long-term consideration. The geopolitical environment continues to evolve, and buyers are aware that ownership structure, tariff exposure and supply chain risk could become more relevant over time. For now, those issues are more of an underwriting consideration than an operating problem.
From a buy-sell perspective, Volvo remains a selective franchise. The best stores can perform well in the right markets, especially where customers understand the brand and are receptive to electrified products. But the franchise is not broadly desirable in every geography. Buyers continue to focus on market fit, product mix, facility obligations, electrification risk and whether the store has enough volume and fixed operations depth to support attractive earnings.
Acura sales declined 0.7% in Q2 2026 compared to Q2 2025, which was essentially flat and slightly better than the overall tone we hear from dealers. Acura products remain reliable and customers are loyal, but the dealer body is frustrated. The biggest issue is not quality, but differentiation. Dealers say Acura is not distinct enough from Honda on the low-end or from stronger luxury competitors on the high-end to command the retail margins they need. Inventory is also more balanced than it was during the supply-constrained period, with some dealers describing supply as full. As inventory has grown, incentives have increased and front-end gross has compressed.
Acura’s current product lineup is narrow. The MDX remains the anchor, but it has become expensive. The RDX is important for volume, but dealers say it can be hard to differentiate from highly contented Honda vehicles like the CR-V, particularly for customers who are focused on value and reliability. The ADX is doing well as a new entry, but it competes in a crowded segment and dealers question how much margin it can support. In many stores, Acura is still selling on price, reliability and loyalty rather than luxury-brand excitement.
Dealer frustration with the factory remains high. Many believe Honda has failed to invest enough product development, marketing and leadership focus into Acura. They see a brand with good vehicles and loyal customers, but not enough identity. Higher ATPs have also made the margin challenge more painful, since customers are being asked to pay luxury prices for products that dealers say are not always perceived as clearly differentiated.
There is, however, more optimism than we have heard in some time. Dealers came away from Acura’s recent dealer meeting in Las Vegas with positive energy, citing new leadership in Japan, more focus on Acura and a product pipeline that could help the brand over the next handful of years. Acura has confirmed that the next-generation RDX will get a two-motor hybrid system, and Acura also previewed a next-generation hybrid SUV prototype tied to a new hybrid system and platform that will begin launching in the next two years. Some dealers believe Acura may be near a trough, and that now could be an interesting time to acquire the franchise before the next product cycle arrives. Buyer demand remains selective today, but a loyal customer base, potential future hybrid products and a lower entry point could make Acura more attractive if the factory delivers.
Lincoln sales declined 15.8% in Q2 2026 compared to Q2 2025, the third-largest decrease among the franchises we track. Dealer feedback varies sharply by market. Some major metro stores are reporting solid performance, helped by stronger luxury demand and a reduced dealer count, while smaller and mid-size markets remain much more challenged. Lincoln is in the final year of its market optimization plan, which is intended to bring the dealer count down to roughly 300 locations and make the brand more competitive with other luxury OEMs. Until that process is finished, dealers say the factory has been relatively quiet about its long-term product and retail plans.
The current lineup is the biggest issue. Lincoln is essentially operating with three core vehicles: the Nautilus, the Aviator and the Navigator. The Nautilus was the only meaningful volume gainer in Q2, increasing 6.4%, while the Aviator declined 1.3% and the Navigator declined 17.4%. Corsair sales fell 61.3%, and dealers miss having a more affordable entry point in the lineup. The next Corsair is expected to return in the next 12-18 months, but the gap is being felt today. Inventory is also tight on many lots, limiting what dealers can do in markets where customers remain interested in the brand.
Dealers believe Lincoln’s pivot away from an aggressive EV strategy has helped. Some think Lincoln is capturing customers who are not interested in Cadillac’s heavier EV push, although it is still early to know how much share is truly moving. The brand’s current products are attractive, and the Navigator and Nautilus give Lincoln credible entries in important luxury SUV segments. Lincoln’s core product challenge is its breadth. A three-vehicle showroom is hard to build around, especially when one of the missing vehicles is the brand’s smaller and more attainable crossover.
Fixed operations remain a critical anchor. Lincoln dealers benefit from being able to perform Ford service and warranty work, which helps support profitability even when new vehicle sales are soft. That back-end earnings base makes the franchise more durable than the sales chart alone suggests.
From a buy-sell perspective, Lincoln remains highly market-specific. Dealers who are on the fence about accepting a buyout and giving up the franchise need to decide whether they are willing to invest in Lincoln as a more standalone luxury business rather than a Ford-dualed add-on. In the right markets, Lincoln can still be profitable and attractive. In weaker markets, limited product, uncertain long-term plans and the ongoing network reduction make the franchise difficult to underwrite aggressively.
INFINITI sales declined 0.2% in Q2 2026 compared to Q2 2025, almost flat in a market that grew 1.2%. For most franchises, that would be an uninspiring result. For INFINITI, it is at least a sign that the brand may be stabilizing after years of lost momentum. Dealers are not calling the franchise healthy yet, but they do see a glimmer of hope. The tone around the brand has improved as new leadership has become more transparent about past mistakes and more direct about what needs to change.
The QX65 is the biggest reason for near-term optimism. The new five-seat sportback SUV has reached showrooms, and dealers report a steady stream of leads from customers asking about it. INFINITI describes the QX65 as a fastback SUV inspired by the old FX, which is exactly the kind of design link dealers have wanted the brand to recapture. Its early Q2 volume was modest, but the vehicle gives INFINITI another sellable nameplate and expands the lineup beyond the QX60 and QX80. Dealers believe the QX65 can help, but they need more products sooner rather than later.
The rest of the lineup remains thin. QX60 sales increased 3.5% in Q2 and the redesigned QX80 increased 18.5%, which is encouraging given how important those vehicles are to the current business. But QX50 and QX55 volume has nearly disappeared, the Q50 is gone, and dealers are effectively operating with only three nameplates. Many stores are still relying heavily on used vehicles and fixed operations to cover overhead. That can work for disciplined operators, but it is not a sustainable substitute for a full product lineup.
Fortunately, the future product pipeline is more compelling than it has been in years. INFINITI is expected to add one new vehicle per year, with the QX65 followed by a future sports sedan and then a hybrid compact SUV using e-POWER technology. The high-performance variant of the QX80 has also been delayed. INFINITI had been developing a higher-output QX80 Red Sport, but recent reporting indicates the launch has been delayed as the brand works on more comprehensive performance upgrades beyond horsepower alone. That delay may disappoint dealers in the short term, but it also suggests the company is trying to avoid another half-step product.
From a buy-sell perspective, INFINITI remains a speculative acquisition. The brand still lacks volume, margin and a broad product lineup. But leadership appears more focused, the QX65 is finally in market, the QX80 is stronger, and dealers appreciate the honesty they are hearing from the factory. Today, INFINITI appears best suited to acquirors able to dedicate significant time to INFINITI operations, dealers with patience and confidence in its product pipeline, and those seeking to expand at affordable blue sky values.
Toyota sales increased 2.6% in Q2 2026 compared to Q2 2025, outperforming the overall market and reinforcing its position as the most valuable mass-market franchise in auto retail. Dealers remain highly positive on the brand, with few complaints outside of how difficult the stores are to buy and how demanding the factory can be during the approval process. Toyota has the right products, the right powertrain strategy and strong OEM support. Inventory also remains tight in many markets, with days’ supply often below 15 days, allowing dealers to maintain healthy gross profits on most products.
Model-level sales data shows the strength of Toyota’s lineup, even with some unevenness. Camry increased 18.5% as the all-hybrid lineup continues to resonate with customers, while 4Runner increased 79.9% as the redesigned model ramps up. Corolla Cross increased 15.6%, Corolla increased 6.6%, Tacoma increased 5.0% and Sienna increased 4.8%. The RAV4 declined 24.2%, but dealers continue to describe demand as extremely strong, with many units presold. The decline appears to be more of a production-transition issue than a demand problem as Toyota prepares for the redesigned 2026 RAV4, which will be offered only as a hybrid or plug-in hybrid.
Second-half production also appears to be improving. Dealers say Toyota has been delivering on the production guidance it provided earlier in the year, and that the expected improvement in supply is beginning to show up. Lexus dealers have seen a similar dynamic, although ES volume was hurt as Lexus paused production during the transition to the redesigned model and its updated hybrid / EV lineup. For Toyota, the key issue is not whether dealers can sell the vehicles they want, but whether they can get enough of the right vehicles.
There are a few pressure points for the network. Several dealers mentioned having too many trucks on the ground, particularly Tundras, and incentives are increasing on weaker truck inventory. This is notable because Toyota dealers need to take their full allocation to sustain current levels, even when certain models are not turning as quickly as the rest of the lineup. Toyota’s EV offerings also remain less competitive than its hybrid products. The brand has an EV back in the market, but dealers generally view Toyota’s near-term EV position as less compelling than its hybrid strategy. Toyota may improve its battery technology over time, but currently, its hybrids are its alternative powertrain leaders.
From a buy-sell perspective, Toyota remains one of the most coveted franchises in the industry. Capital requirements are high, approval is difficult and facility investment can be expensive. Dealers noted that the allocation benefit tied to capital projects has become more costly, increasing from roughly $8,000 of investment per incremental allocated unit to around $11,000. Still, with many models producing more than $4,500 of combined front- and back-end gross, buyers continue to underwrite Toyota aggressively. The Toyota formula remains steady: tight supply, strong products, trusted hybrids, excellent factory support and durable buyer demand, and this combination of factors has continued to drive transaction multiples upwards.
Honda sales increased 9.4% in Q2 2026 compared to Q2 2025, well ahead of the overall market. Dealers remain highly positive on the franchise. Throughput continues to improve, the product lineup is in excellent shape, and the factory relationship is considered constructive. Honda is also benefiting from a few product and pricing strengths: affordable enough for payment-conscious consumers, trusted enough to retain loyal customers, and increasingly well positioned in hybrids. The CR-V remains the brand’s workhorse and increased 16.0% in Q2, while Accord sales increased 41.2% and Civic sales increased 8.1%. Dealers are particularly pleased with Honda’s hybrid lineup, which gives customers better fuel economy without forcing them into an EV.
The “Blue Stage” facility program has been a major topic with dealers, but the feedback was more favorable than we expected. Dealers acknowledge the program is expensive, but several said the investment makes sense. One dealer noted that most modern facility programs require a lot of glass, and glass is expensive regardless of brand. Others were more direct: with Honda ATPs now much higher than they were before COVID, customers expect a more upscale retail experience. A $50,000 customer does not want to wait for service in a dated lounge or buy a vehicle from a tired showroom.
Dealers also see benefits beyond the customer experience. One dealer said a recent renovation helped unlock higher volume and profit, while also improving employee morale. Another said facility upgrades have become a requirement for any dealer who wants to attract both customers and talent. People want to work in nice facilities, and customers increasingly expect the dealership experience to match the price of the vehicle they are buying.
Importantly, dealers give Honda credit for how it is handling the program. Honda’s facility costs are not cheap, but dealers told us they are more reasonable than several competing OEM programs. One dealer estimated Honda’s upgrade cost at roughly half of Hyundai’s. Another cited a Texas store where Honda extended the facility timeline to five years and promised a sizable allocation increase, even though the store was already highly sales effective. That kind of accommodation gets positive attention. Dealers were quick to compare Honda’s approach with more rigid and expensive programs at certain luxury brands and competing import brands.
Honda appears positioned for continued strength. The product lineup is performing, hybrid demand remains strong, global scale helps dilute tariff costs, and leadership appears focused after a sluggish period for the brand. From a buy-sell perspective, Honda remains one of the most attractive midline franchises in the market: high throughput, loyal customers, strong products, reasonable facility economics and a factory that dealers generally trust.
Subaru sales increased 6.8% in Q2 2026 compared to Q2 2025, outperforming the overall market and improving from the weakness we discussed in our last report. Dealer sentiment remains positive, although the franchise is significantly more market-dependent than most. Subaru stores in the Northeast, Midwest and mountain or outdoor markets can be exceptional. Dealers in certain Sunbelt markets are less enthusiastic, and buyer demand often follows the same pattern. Subaru multiples are partly defined by latitude.
The Q2 model data was encouraging, but not uniformly strong. The Forester increased 16.5%, the Outback increased 7.7%, the Crosstrek increased 5.1% and the Ascent was essentially flat. These vehicles carry the most weight for dealership new vehicle volumes and profits. The WRX also more than doubled, but off a smaller base. On the other hand, the Impreza, Legacy and Solterra all declined, reinforcing the view that Subaru’s strength remains concentrated in its core crossover lineup rather than in its sedans or EVs. The all-new Trailseeker and Uncharted also began contributing volume, but those EV products are still too new to judge.
Dealers give Subaru credit for becoming more responsive. Rather than applying broad discounts across the lineup, the factory has been placing incentive money on specific models where inventory has increased or demand has softened. Dealers like that approach. It helps move the right vehicles without damaging pricing discipline across the entire brand. The factory’s willingness to listen has strengthened confidence in Subaru’s leadership, particularly after a period when some retailers felt inventory and product issues were building.
Fixed operations remain one of Subaru’s biggest advantages. The brand has a large, loyal and aging UIO base that produces dependable warranty, maintenance and customer-pay repair work. That recurring income gives Subaru stores a cushion when new vehicle margins tighten. The longer-term concern is whether Subaru can protect that UIO base as its product strategy shifts. The brand is adding more EVs, including the Trailseeker and Uncharted, while the 2026 Outback has been redesigned and the Solterra has been updated. Dealers are not opposed to electrification, but they worry that an overly EV-heavy pipeline could hurt share if misaligned with consumer demand.
Facility requirements are the other pressure point. Subaru’s image program can create a more experiential dealership, with large retail areas, outdoor-lifestyle displays and pet-friendly amenities such as dog parks. Some dealers like the differentiation; others view parts of the program as wasted space. The economics also vary by market. Dealers in the Midwest often see the upgrade as a no-brainer, while retailers in expensive metros low-volume markets are more frustrated by changing requirements and space demands. Completed facilities should help valuation, but stores with unfinished image work may face buyer adjustments for future capex.
Kia sales increased 2.8% in Q2 2026 compared to Q2 2025, outperforming the overall market and continuing the brand’s steady climb in the U.S. Dealers generally prefer Kia to Hyundai, not because the product story is dramatically different, but because the factory relationship feels better and the economics are cleaner. Hyundai Motor Group gives both brands the benefit of scale, capital and R&D, but Kia dealers tell us they feel more like partners and less like the factory is trying to reach back into their margin.
In Q2, the Sportage was Kia’s highest-volume model and increased 9.4%, while the Telluride increased 19.0% despite the model transition. The Seltos increased 31.3%, the Carnival increased 15.4% and the Sorento increased 7.9%. EV9 volume also grew sharply off a small base, while both the EV6 and Niro declined. The Soul essentially disappeared from the sales mix, and the K4 declined 5.5% as Kia continues to reset its passenger car lineup.
Dealer sentiment remains positive. Kia’s products are well-designed, well-priced and improving in quality and customer perception. Dealers are also bullish on the future product plan. The redesigned Telluride adds a hybrid powertrain, which should help one of Kia’s most important products remain competitive against the Toyota Grand Highlander, Honda Pilot and Hyundai Palisade. Kia has also outlined a plan to expand its U.S. hybrid lineup from four models to eight, grow the Sportage into a 200,000-unit product, add a hybrid Seltos, and eventually enter the U.S. pickup segment. This pipeline is highly aligned with what dealers and customers want for the U.S. market: more SUVs, more hybrids and less dependence on pure EV adoption.
The comparison and resulting contrast with Hyundai has become hard to ignore. Hyundai-Genesis dealers continue to complain about facility requirements, approval difficulty and factory turnover. Kia is not perfect, but dealers describe a more constructive relationship and better ability to hold margin. This connection is highly important to dealers in a market where many OEMs are looking for ways to absorb or offset tariff costs, fund incentives and manage image programs.
From a buy-sell perspective, Kia remains one of the more attractive midline import franchises. It has strong products, a better factory relationship than Hyundai, and a product pipeline that lines up well with consumer demand. Buyers are still mindful of facility obligations and the fact that Kia shares some of Hyundai Motor Group’s broader strategic risks, but dealer enthusiasm remains high. For many buyers, Kia is the safer and easier way to invest in the strength of the Hyundai Motor Group product machine.
Hyundai-Genesis sales increased 4.1% in Q2 2026 compared to Q2 2025, outperforming the overall market. The product lineup remains the main reason dealers still like the franchise. Hyundai and Genesis continue to offer attractive designs, strong technology, long warranties and competitive value, and dealers believe the scale and capital strength of Hyundai Motor Group will allow the OEM to keep investing in R&D, hybrids, EVs and future platforms. The Tucson increased 6.6% in Q2, Elantra increased 13.3%, Palisade increased 15.5%, Sonata increased 31.0%, and Genesis’ two most important products, the GV70 and GV80, increased 4.5% and 6.3%, respectively.
Dealer sentiment toward the factory, however, remains mixed at best. Retailers continue to describe Hyundai as difficult to deal with, particularly around facility image requirements, approval processes, incentive programs and factory expectations. Dealers also noted significant turnover within Hyundai’s corporate organization, which has made it harder to build lasting relationships with field representatives. The result is inconsistency in communication and support. Several dealers told us they prefer the Kia franchise because the product is strong, the factory relationship is better, and Kia dealers often feel they are able to keep more of the margin they create.
That last point is the key differentiator between these brands. Dealers believe Hyundai has a strong product lineup, but they also feel the factory has a way of identifying where margin exists and taking some of it back through programs, requirements or incentive structures. Variable operations remain healthy, but fixed operations are not growing as quickly as some dealers would like. Facility costs are another underwriting issue. Hyundai and Genesis image requirements can be expensive, and buyers are paying close attention to future capital obligations when evaluating stores.
The product pipeline should remain a major advantage. Hyundai’s 2026 lineup includes the all-new Palisade and IONIQ 9, and Hyundai has said it plans to expand its hybrid lineup to more than 18 models by 2030, including Genesis hybrids beginning in 2026. Genesis has also announced 22 all-new or significantly enhanced vehicles for North America through 2030. That is the benefit of being part of a global OEM with money to spend. From a buy-sell perspective, Hyundai-Genesis remains desirable because the products are good and consumer demand is healthy. But buyers factor the tense factory relationship, approval risk and facility obligations into valuations, which is why many still view Kia as the cleaner way to invest in the same product momentum.
Mazda sales increased 7.4% in Q2 2026 compared to Q2 2025, outperforming the overall market and bringing sales back on track after a rare sales slip in Q2 last year. Dealers are still positive on Mazda. Its products are attractive, designs are well-received, customer loyalty continues to improve, and factory-dealer relations remain strong. But the tone is more measured than it was a few years ago. The hype around Mazda’s growth story has flattened as the brand works through tariff pressure, tougher competition and the challenges that come with being a smaller OEM in a market dominated by larger, better-capitalized competitors.
Mazda’s lineup is solid but narrow. The brand is heavily dependent on light SUVs and a limited lineup of sedans, which leaves little margin for error when a major segment becomes more competitive. The CX-50 remains a key product and gives Mazda a slightly larger compact crossover than the RAV4, but dealers note that the segment is crowded and competitors have broader hybrid offerings. Mazda’s hybrid products are improving, but some dealers worry the brand is losing the fuel economy battle. The CX-50 Hybrid is rated around 38 mpg combined, while competing hybrids from Toyota, Honda and Kia are often perceived as stronger in both efficiency and consumer awareness.
The product pipeline should help, but it will take time. Mazda has confirmed that the next-generation CX-5 will receive Mazda’s in-house hybrid system and new SKYACTIV-Z engine by the end of 2027. The brand is also planning a battery-electric vehicle on its first dedicated EV platform in 2027. That timing leaves dealers waiting while competitors continue to expand their own hybrid and EV lineups. Dealers like Mazda’s product direction, but they acknowledge that Toyota, Honda and Hyundai-Kia have larger R&D budgets and can move faster with both technology and incentives.
Tariffs are another pressure point. Dealers said the impact is not unique to Mazda, but smaller OEMs have less room to absorb cost increases or fund aggressive incentive programs. That can put Mazda dealers in a difficult position: they have attractive vehicles, but they are competing against brands with more scale, broader powertrain offerings and deeper marketing budgets.
From a buy-sell perspective, Mazda remains a franchise with many attractive qualities, including improving customer loyalty, good design, solid factory relations and approachable facility expectations. But the brand is also dealing with growing pains. Mazda’s growth arc is still intact, just less sure than it looked a few years ago. Buyers continue to like Mazda, but they are also watching tariff exposure, hybrid timing, incentive pressure and the brand’s ability to compete against much larger OEMs in crowded SUV segments.
Nissan sales increased 10.2% in Q2 2026 compared to Q2 2025, matching the improving sentiment we are hearing from dealers. We are hearing that the brand is moving in the right direction and would be worth pursuing in the right market. Several dealers said Nissan has the best leadership team it has had in many years, and one commented that if this group had been in place seven to ten years ago, Nissan might not be in its current position. That is high praise for a franchise that has tested dealer patience for a long time.
The volume recovery was broad enough to be encouraging. Rogue sales increased 38.6% in Q2 and remains the critical showroom anchor. The Pathfinder increased 32.1%, the Sentra increased 28.5%, the Frontier increased 34.6%, the Armada increased 27.0% and the Kicks increased 4.9%. Those gains were offset by weakness in the Altima, Versa, Ariya and Z, but dealers are more focused on the improvement in SUVs, pickups and lower-priced passenger cars that still bring customers into the showroom. Nissan is not back to full strength, but it is no longer being discussed only as a broken brand.
The biggest product gap remains hybrids. Dealers are split on whether Nissan is already on a recovery path or whether the real turnaround is still several years away, but nearly everyone agrees the lack of hybrid product has been costly. Toyota, Honda, Hyundai and Kia are all taking advantage of hybrid demand, while Nissan is only now beginning to catch up. The 2026 Rogue Plug-in Hybrid has started reaching showrooms, offering up to 38 miles of electric-only range and up to 420 miles of total range, but dealers worry it may be priced too high to land with enough consumers. The more important product may be the 2027 Rogue Hybrid e-POWER, which Nissan says is coming in late 2026 and will bring its third-generation e-POWER system to the U.S. market
For now, fixed operations and used vehicles remain essential to keeping dealerships in the black. Nissan dealers are still working through thin margins, heavy competition and an uneven product lineup, but the tone has changed. Dealers believe leadership is more honest, more transparent and more willing to “roll up their sleeves” to fix the franchise. From a buy-sell perspective, Nissan remains market- and operator-dependent, but buyer interest is returning. The stores still require careful underwriting, but a lower entry point, improving volume, better leadership and the coming hybrid cycle are giving buyers a reason to look again.
Volkswagen sales increased 24.9% in Q2 2026 compared to Q2 2025 and are up 2.3% year-to-date. The headline result looks impressive, but it’s a bit misleading. Much of the Q2 increase appears to have been driven by a large shipment of Tiguans that had been held in Mexico in 2025 while Volkswagen waited for a potential resolution to tariff issues. That makes the sales rebound less reflective of a true demand increase than the headline percentage suggests.
Volkswagen is also working through broader challenges as a company. VW Group has announced a significant restructuring plan intended to reduce complexity, lower costs and make the organization more competitive. That plan may be beneficial for the long-term health of Volkswagen globally, but it does little to improve dealer confidence in the U.S. today. Dealers remain concerned that Volkswagen is not moving quickly enough to deliver the products, powertrains and pricing needed to compete more effectively in this market.
Volkswagen does have several attractive vehicles for U.S. consumers, including the Tiguan and Atlas. The problem is that those products are competing directly against very strong offerings from Toyota, Honda, Hyundai and Kia. Many U.S. customers are shifting toward hybrids, and Volkswagen currently offers no hybrid models in the U.S. That is a major gap. Its ICE products have attractive styling and driving characteristics, but dealers say they still fall short versus leading competitors in reliability, software and overall cost of ownership.
Tariffs are another headwind. A significant percentage of Volkswagen’s U.S. volume is imported, creating a cost disadvantage versus brands with larger North American production footprints. Perhaps Volkswagen’s restructuring will eventually help the company build better products at lower prices and become more responsive to U.S. market demand. Until then, many Volkswagen dealers are likely to remain under pressure from low throughput and weak profitability.
The dealer network is frustrated. Many locations are losing money, and we are hearing that some dealers are closing Volkswagen points and converting the facilities for use by other brands. One way to improve sales and morale would be to announce that Scout vehicles will be sold through Volkswagen dealerships rather than directly to consumers. Scout may not become a high-volume brand, but it would give customers a new reason to visit Volkswagen stores and help resolve an issue that has become highly divisive between Volkswagen and its dealers.
From a buy-sell perspective, Volkswagen remains one of the more difficult franchises to value. Until profitability improves, most Volkswagen dealerships will likely be valued on a flat-dollar basis rather than a multiple of trailing earnings. The franchise has brand equity and some good products, but buyers need to see better U.S.-focused product cadence, hybrid availability, tariff mitigation and a more constructive path to dealer profitability before underwriting Volkswagen more aggressively.
Chevrolet sales declined 3.8% in Q2 2026 compared to Q2 2025, underperforming Ford, CDJR and the overall market. Dealers remain generally positive on the brand, especially those with larger stores, but many are frustrated by allocation, particularly those in tier two or three markets. The vehicles dealers want most are Silverados, Tahoes and other higher-grossing trucks and SUVs. The vehicles they can get more easily are often smaller cars and crossovers that serve payment-conscious customers but carry far less dealer margin.
The model-level sales data supports dealers’ complaints. Silverado volume declined 7.3% in Q2, the Tahoe declined 8.1% and the Suburban declined 20.4%. Those declines are painful because they are happening to the highest-profit products in Chevy showrooms. At the same time, lower-priced utility vehicles held up better. The Traverse increased 19.5%, the Trailblazer increased 28.4%, Equinox ICE increased 6.9% and the Trax was essentially flat. That mix helps Chevrolet maintain volume, but it does not solve the margin issue for dealers who are short on high-gross products.
Smaller and mid-sized Chevrolet dealers appear to be feeling the allocation pressure most acutely. Several dealers told us that the largest stores are receiving more Silverados and full-size SUVs, while smaller operators are working harder to make money with lower-margin inventory. That can make profitability choppy even when the brand itself remains healthy. Dealers with large Chevrolet stores, however, continue to describe a balanced business model, with strong variable operations, large UIO bases and dependable fixed operations.
Dealers are pleased that GM has moderated its EV push and appears increasingly willing to listen to what customers want to buy and retailers want to sell. Chevrolet still has EVs in the lineup, including the Equinox EV, Blazer EV, Silverado EV and the returning Bolt, but the dealer body is happier when GM emphasizes trucks, SUVs and attainable ICE products. The next-generation 2027 Silverado should help, with Chevrolet announcing updated V8 engines, new technology and a broader trim strategy when it goes on sale later this year.
From a buy-sell perspective, Chevrolet remains attractive, especially for larger, high-volume stores. Buyers like the brand’s scale, truck business, fixed operations opportunity and strong product direction from GM. The challenge is supply mix. If a store is receiving enough trucks and full-size SUVs, Chevrolet can produce excellent returns at current multiples. If the store is smaller or under-allocated on those products, the investment case becomes more dependent on expense control, used vehicles, fixed operations and the ability to make money on lower-margin units.
Buick-GMC sales declined 2.0% in Q2 2026 compared to Q2 2025, but the franchise remains in a better position than it was a few years ago. Dealers came out of Buick-GMC’s recent Las Vegas meeting with more enthusiasm than we have heard in some time, driven by clearer product direction, stronger Buick styling and continued confidence in GMC’s truck and SUV lineup. Dealers who kept Buick after the recent buyout efforts now have a better sense of what the brand is trying to be: more affordable, younger and easier to retail. The current issue is that the factory support has not yet matched the energy dealers felt coming out of the meeting.
Buick is showing both promise and pressure. Dealers like that Buick is attracting younger buyers, and products such as the Envista and Encore GX have helped bring new customers into the showroom. But the quarter was difficult. Dealers noted that tariff-related price increases, lower rebate support and higher lease payments are making Buick harder to retail. One dealer said some Buick leases are roughly $200 per month higher than prior leases, causing loyal customers to shop Lincoln, Honda and Toyota for the first time in years. Buick does not lack appeal; but its entry-level premium buyers are highly payment-sensitive, and Buick needs the right lease support to keep those customers in the brand.
GMC is still the profit engine. Dealers continue to demand more large GMC products, particularly Sierras and higher-trim SUVs, but Q2 was a bit of a transition period for the brand. The redesigned Sierra is expected later this year, and some customers appear to be waiting for the updated product that GM announced in July. That has made the current Sierra market more promotional, with dealers competing aggressively to move existing inventory. Dealers also noted that the Canyon, Terrain, Yukon and Acadia have not received enough factory rebate support, forcing retailers to use their own discounts to stay competitive against Ford, Ram and Lincoln.
Even with these issues, dealers are still positive on long-term direction. Buick gives the store a more affordable entry point and incremental customer reach, while GMC supplies the higher-margin trucks and SUVs that support dealership profitability. Dealers are also encouraged that GM is investing to bring more production stateside, which could help reduce future tariff exposure on models like the Envision.
From a buy-sell perspective, Buick-GMC remains more attractive than it was before Buick’s network reset. The best stores offer affordable Buick volume, profitable GMC trucks and SUVs, and a fixed operations base that should benefit as Buick brings younger customers into the ownership cycle. Near-term factory support and lease competitiveness need to improve, but the product direction, dealer commitment and GMC profit opportunity still support the improvement in franchise perception we noted last quarter.
Ford sales declined 10.5% in Q2 2026 compared to Q2 2025, underperforming its domestic rivals and the overall market. Dealer sentiment remains steady, but not enthusiastic. The franchise is not facing the same level of dealer distress as CDJR, and Ford still has several highly desirable products, but dealers continue to point to a major product and price point gaps. Ford wants its dealers to sell more vehicles, but dealers say too many of the vehicles they have are expensive trucks, SUVs and specialty products rather than the attainable crossovers many customers are shopping for.
F-Series remains the core of the franchise, and sales declined 12.3% in Q2. Some of this was supply related stemming from the 2025 Novelis fire, and dealers are watching closely to see when F-150 volume returns and whether there is pent-up demand for trucks that were unavailable or harder to find. The Explorer increased 13.8%, the Bronco increased 15.9%, the Transit increased 7.7% and the Mustang increased 3.4%, softening the F-Series drop. But the Escape declined 74.1%, the Edge is now gone, the Bronco Sport declined 6.7%, the Ranger declined 9.8%, the Expedition declined 27.0% and the Mach-E declined 30.9%. The loss of the Edge and the aging of the Escape have been painful because Ford is losing ground in one of the most important and competitive parts of the market.
Dealers are especially frustrated by the compact and midsize crossover gap. Ford has strong brand equity, a massive truck business and loyal customers, but it does not currently have enough affordable, high-volume utility vehicles to meet the market where many buyers are today. That puts dealers in a difficult position. They can compete aggressively on price and payment, but the lineup itself does not give them as many tools as Toyota, Honda, Hyundai, Kia or Subaru.
The product pipeline may eventually help. Dealers say Ford has shown them several more affordable vehicles in development, including products that could address the lower-priced end of the market, but those vehicles appear to be at least a couple of years away. In the meantime, dealers are relying on the F-Series, commercial vehicles, the Bronco, the Explorer and used cars to stay competitive.
From a buy-sell perspective, Ford remains an important domestic franchise, but buyer enthusiasm is more measured than it was when truck supply was tighter and front-end grosses were easier to hold. Dealers need more affordable product, clearer crossover coverage and a recovery in truck volume. Until then, Ford stores can still be strong businesses, but performance will vary by market, and factors like expense control, commercial strength and dealers’ ability to manage around the current product gaps will become even more important.
CDJR sales increased 6.4% in Q2 2026 compared to Q2 2025, the best performance of any domestic franchise, but dealers are less optimistic than they were earlier this year. A few months ago, there was more excitement that Stellantis may finally be turning a corner. Today, that tone is more cautious. Dealers are still waiting for evidence that the turnaround is materializing in product, quality, customer experience and dealer profitability. The problem is not a lack of promises. The problem for Stellantis is that dealers have heard many of their promises before.
The sales data was mixed across the portfolio. Ram carried much of the improvement, with Ram 1500 sales increasing 15.4% in Q2. Chrysler was also up sharply, helped by Pacifica volume, while Dodge declined 15.3% and Jeep declined 5.5%. The Grand Cherokee and Wrangler remained the largest Jeep products, but both declined, and dealers are still looking for a stronger, more consistent product cadence. The new Cherokee should help restore coverage in an important segment, but the brand still needs products customers want, priced where customers can afford them, and built with better quality.
Dealer frustration remains high. Many retailers say product quality is still poor, recalls remain a major issue, and customer relations with the factory continue to be difficult. Dealers also believe the incentive and rebate structure remains too complicated. Simplifying programs would make the sales process easier for customers, easier for salespeople and better for overall dealership execution.
Leadership change is another issue. Stellantis recently appointed new CEOs for both Ram and Jeep, with Matt VanDyke leading Ram and Branden Coté leading Jeep as part of CEO Antonio Filosa’s broader effort to reset the company’s leadership team. Dealers welcome experienced leadership, but the constant change makes it difficult for the organization to stay focused on long-term objectives. The dealer body wants stability, better products and a clearer plan.
The financing side is also creating headaches. Dealers noted that the Santander relationship ending has disrupted lease return flows, with some vehicles going to auction rather than returning naturally through the dealer network. That takes away used vehicle opportunities at a time when many CDJR stores need every profit lever they can find.
From a buy-sell perspective, CDJR is still broadly considered a turnaround opportunity, but the optimism has cooled. Strong operators can still make money, particularly with Ram, used vehicles and fixed operations, but buyers are underwriting the franchise carefully. The system is not fixed yet. Dealers need product quality to improve, incentives to become simpler, leadership to stabilize and the factory to prove it is serious about rebuilding dealer profitability.